California wildfires information design
Overview
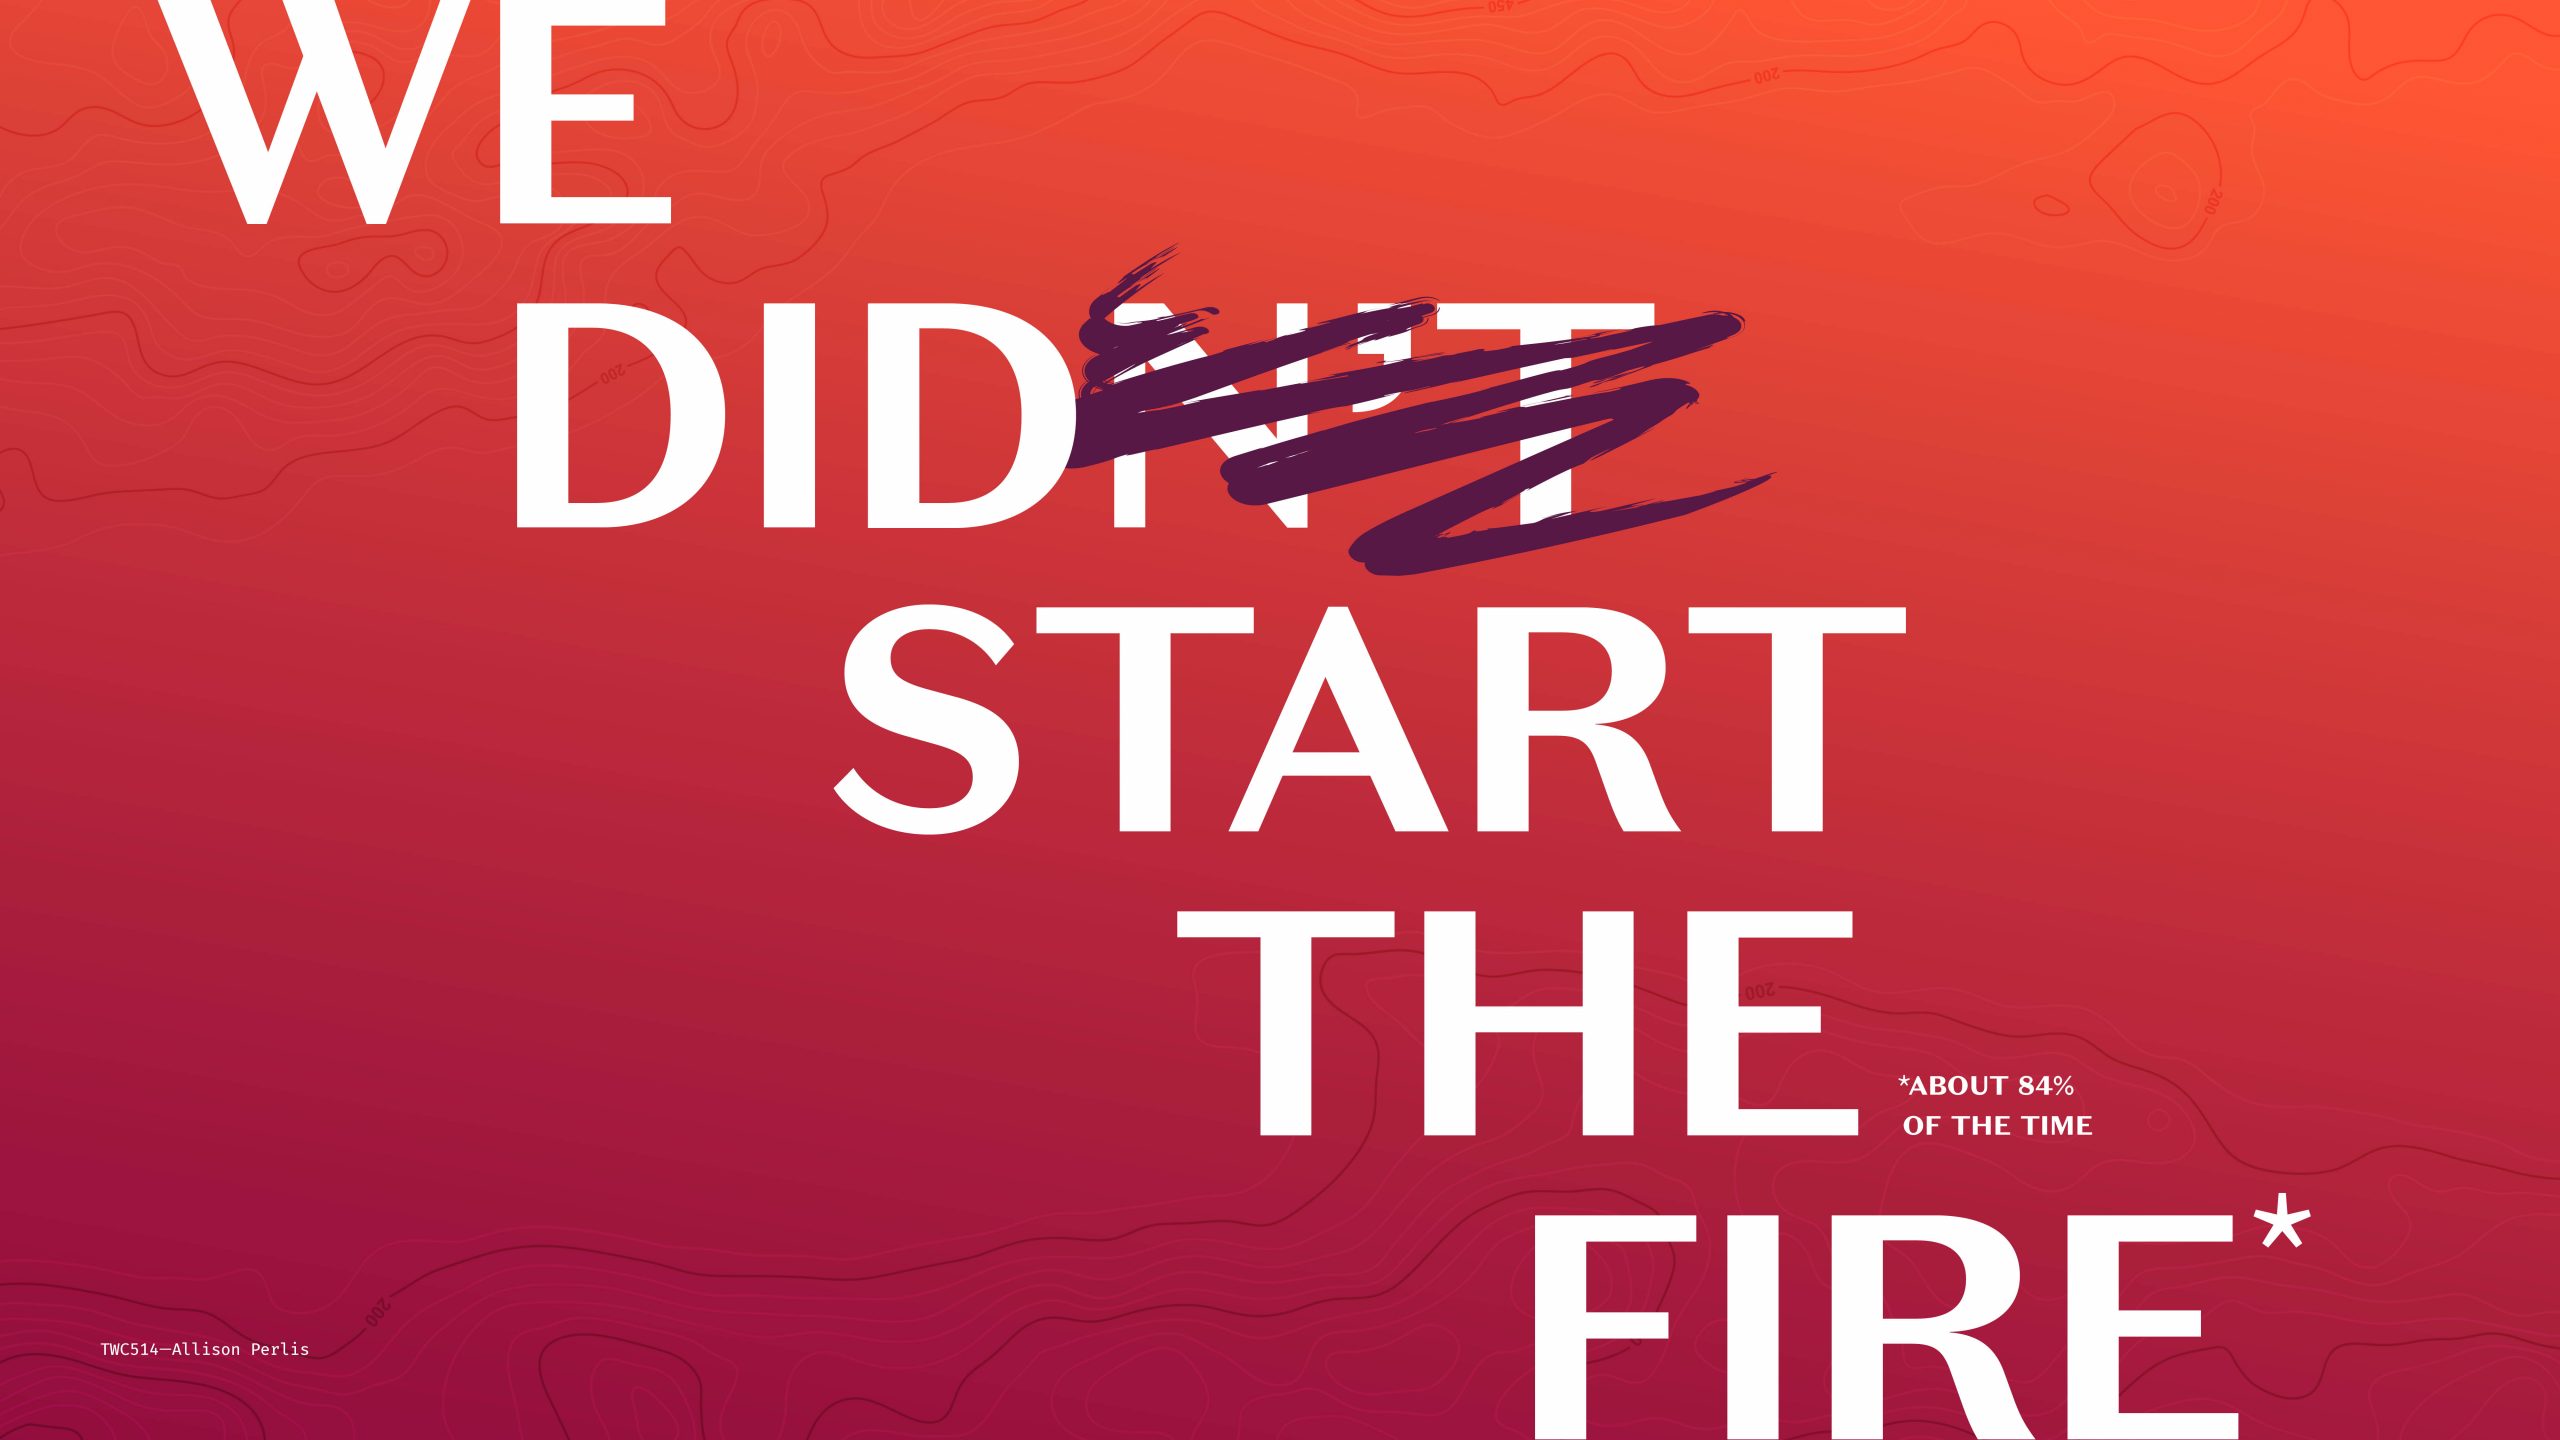
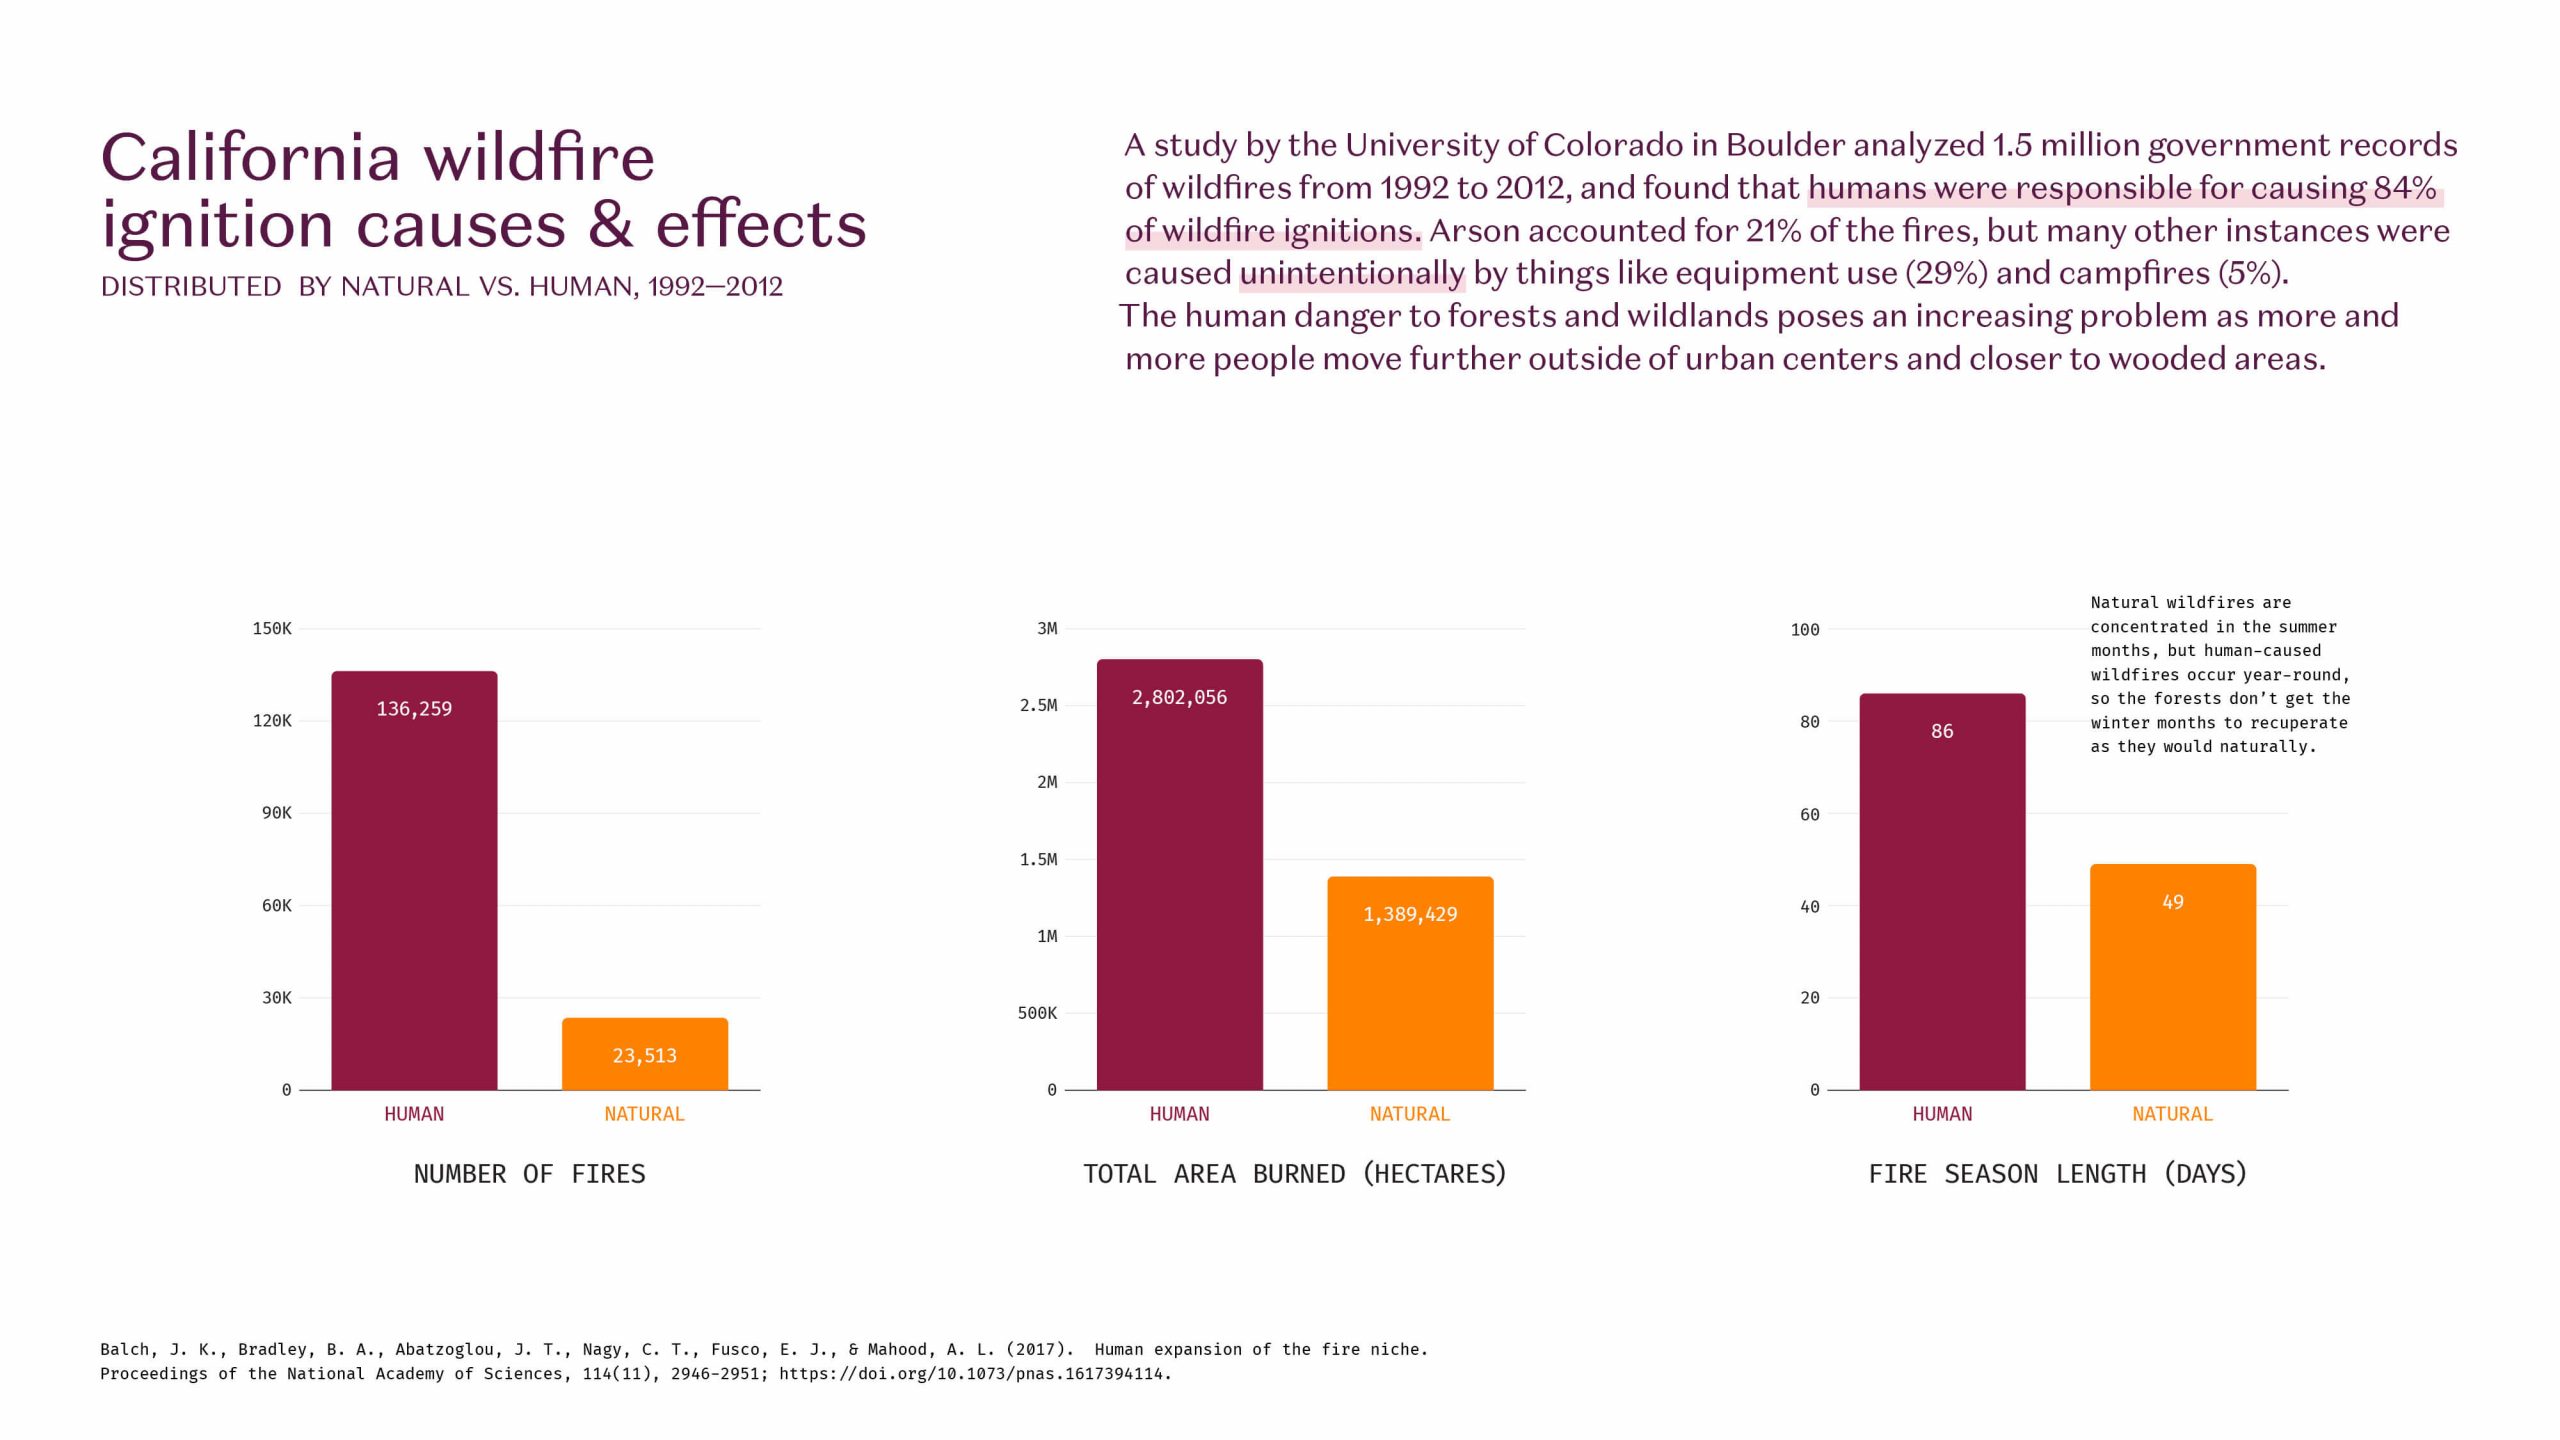
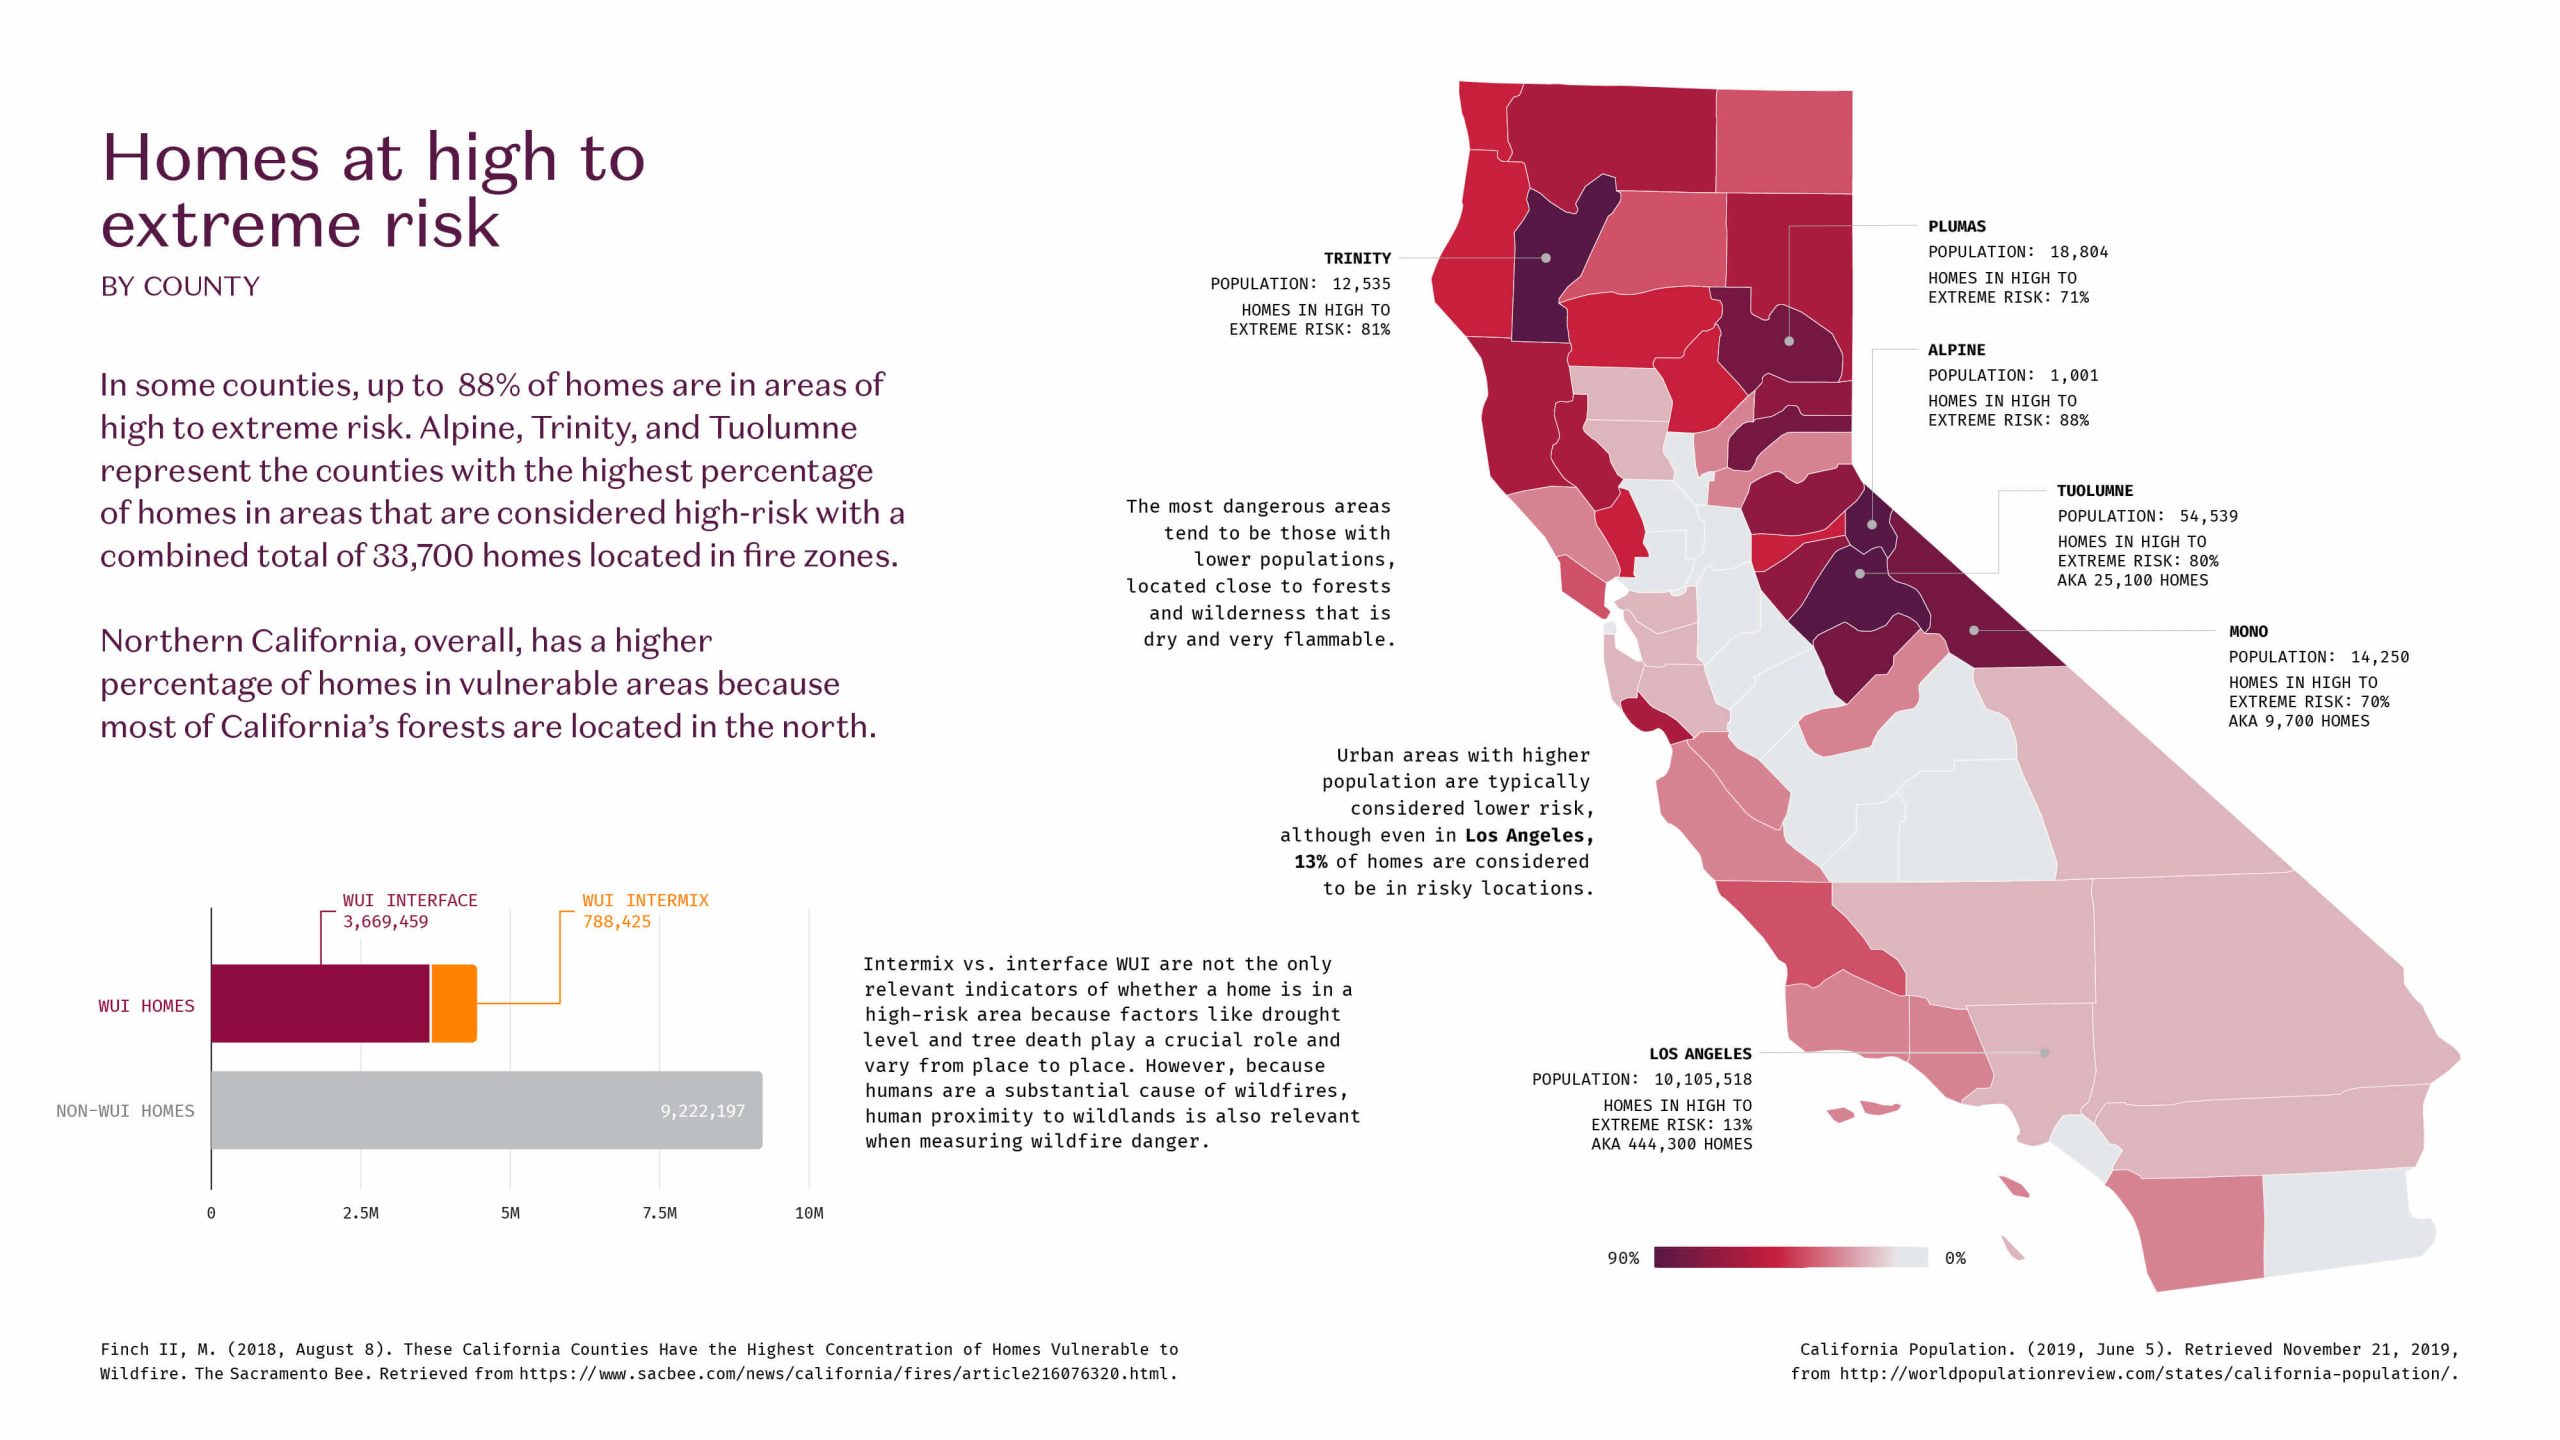
Information design project centered around wildfires in California. Data indicated that a primary cause of the uptick in wildfires in recent years ties into the housing shortages in California — there are too many people and too few houses in urban areas so housing developments encroach on wildlands which catch fire very easily.
services
Research
Data Analysis
Information Design
Research
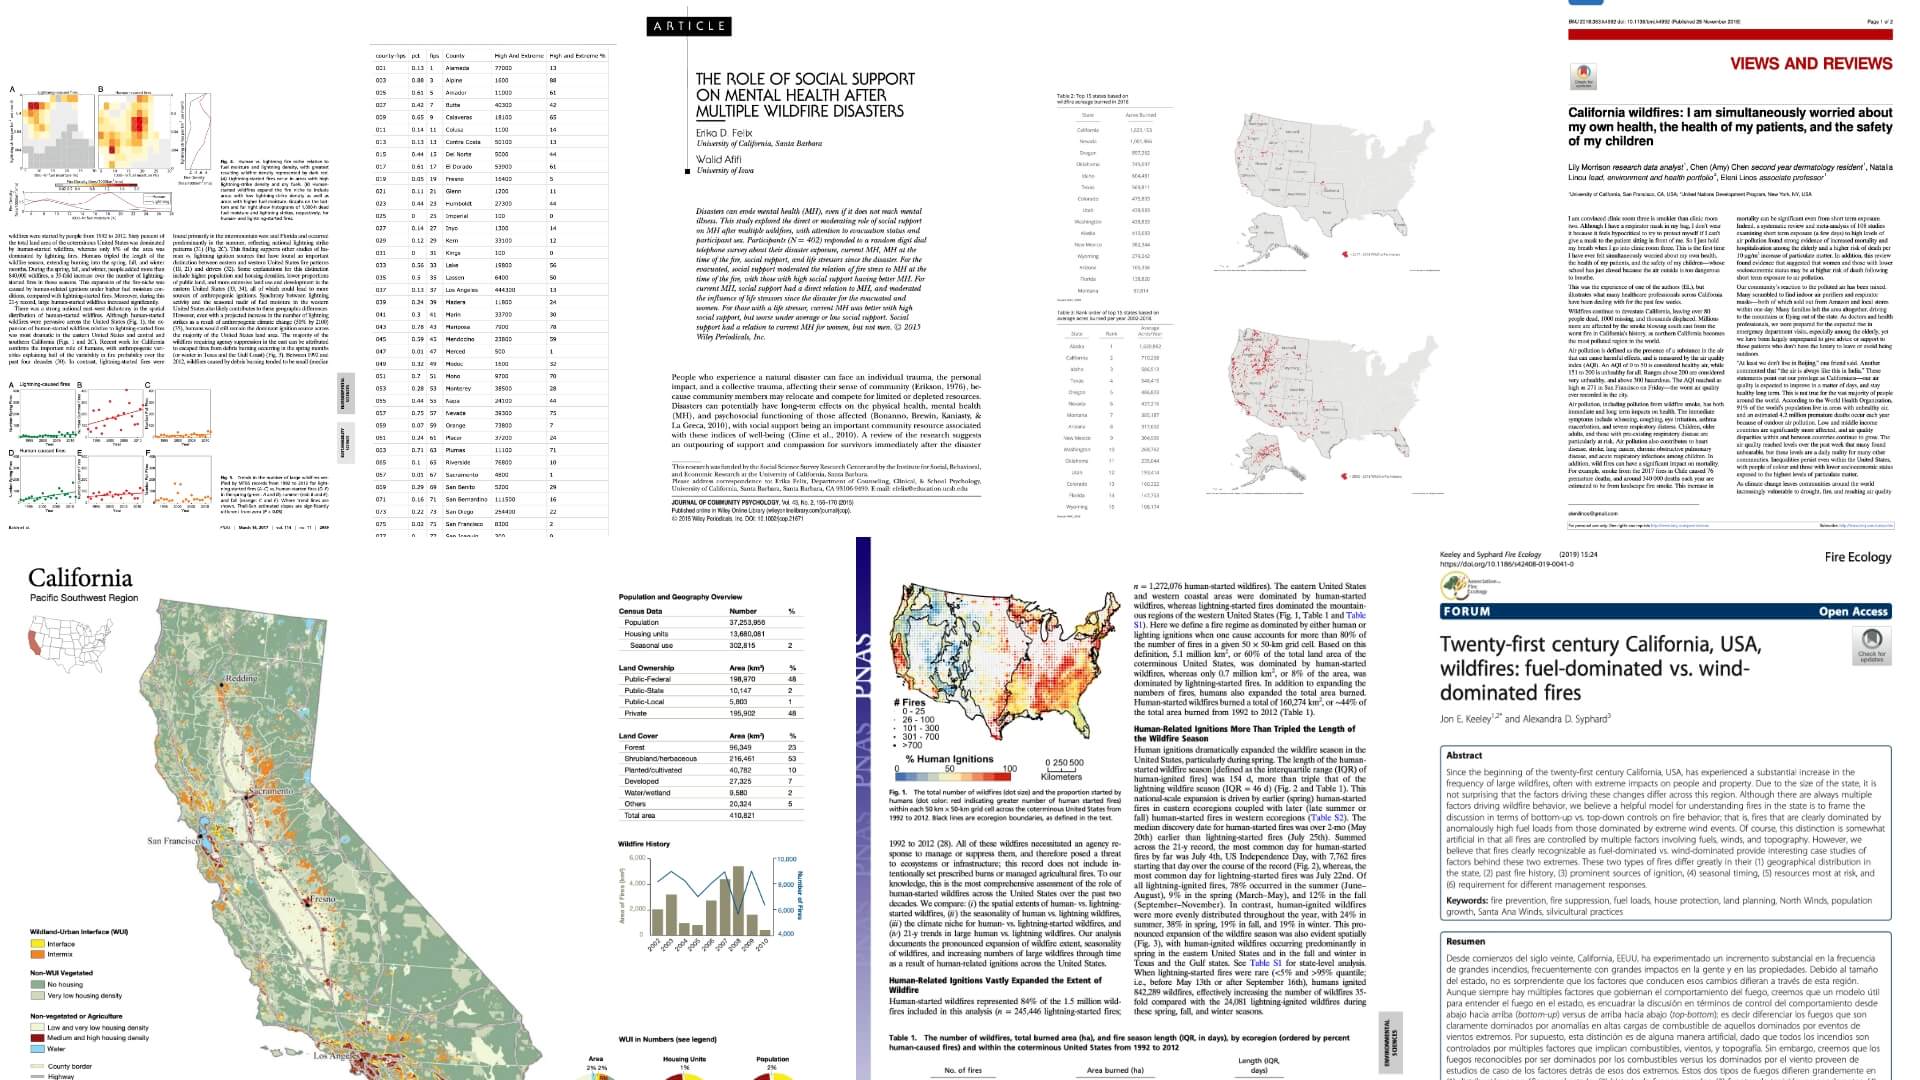
The first step was to research basic information about forest fires in California. Then, I was able to confirm my initial hypothesis that the number of annual forest fires had been increasing, and I began collecting the data I found into spreadsheets to allow for quicker analysis.
Data Analysis
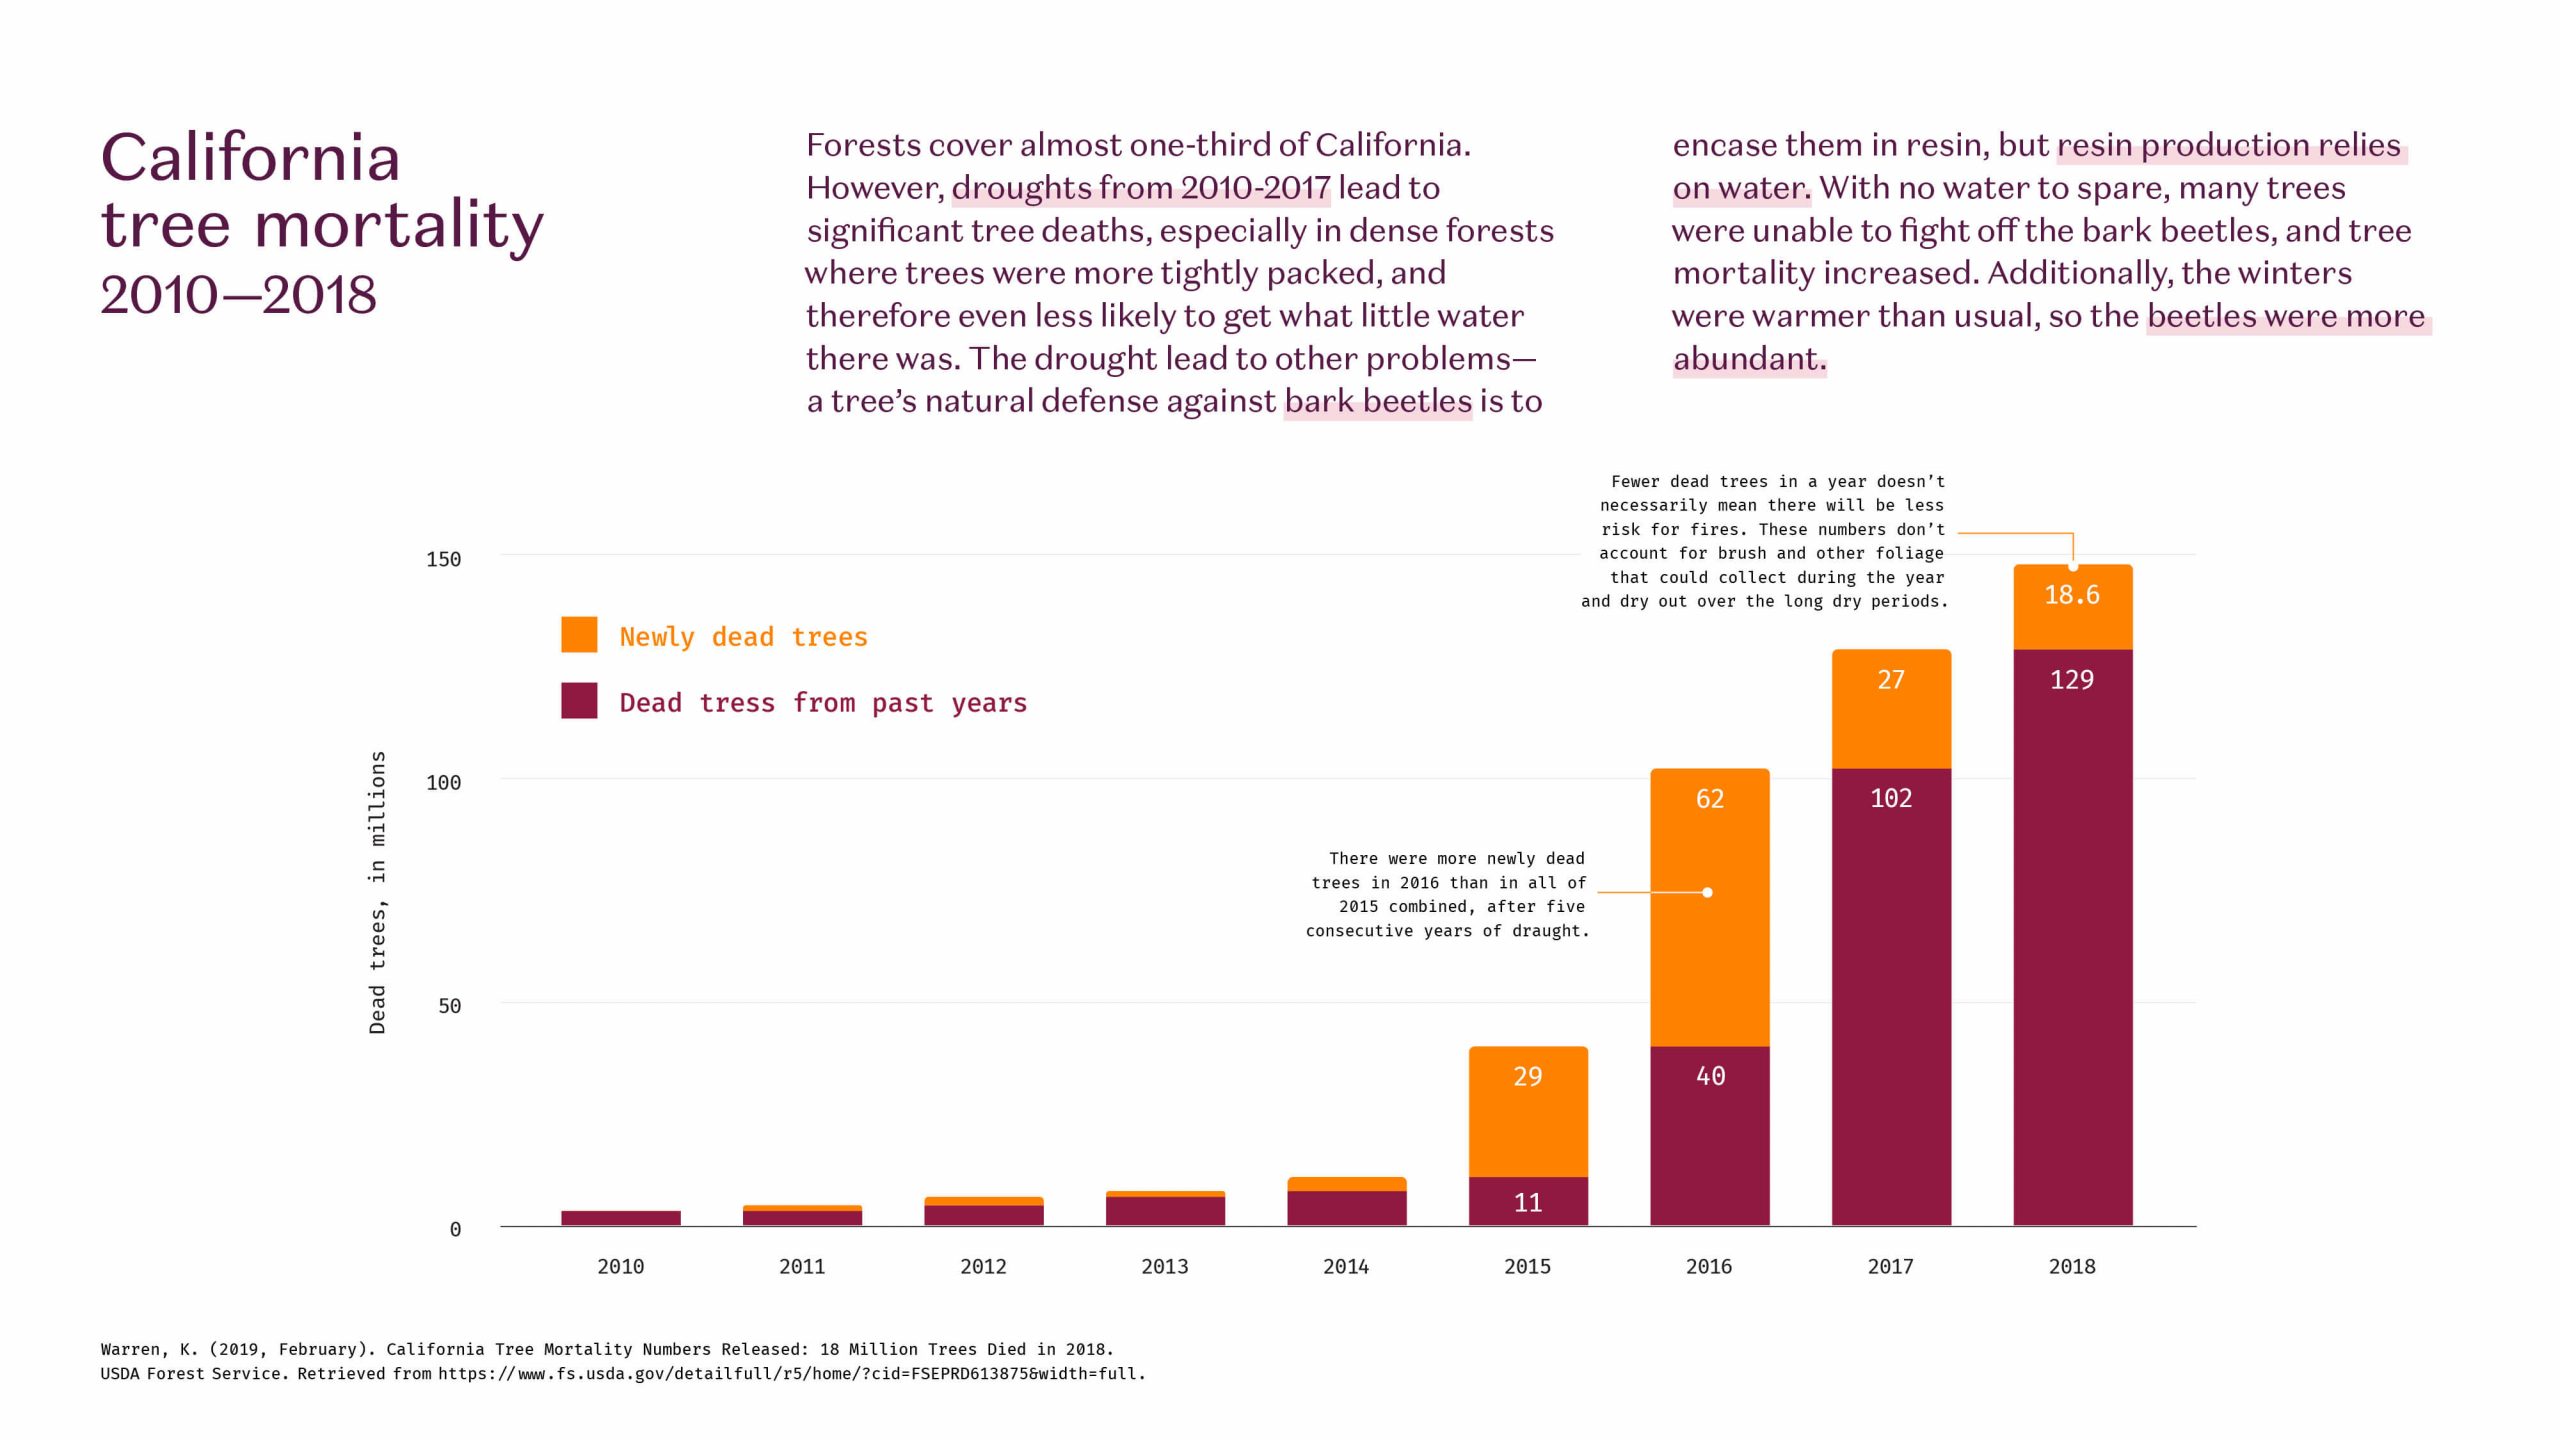
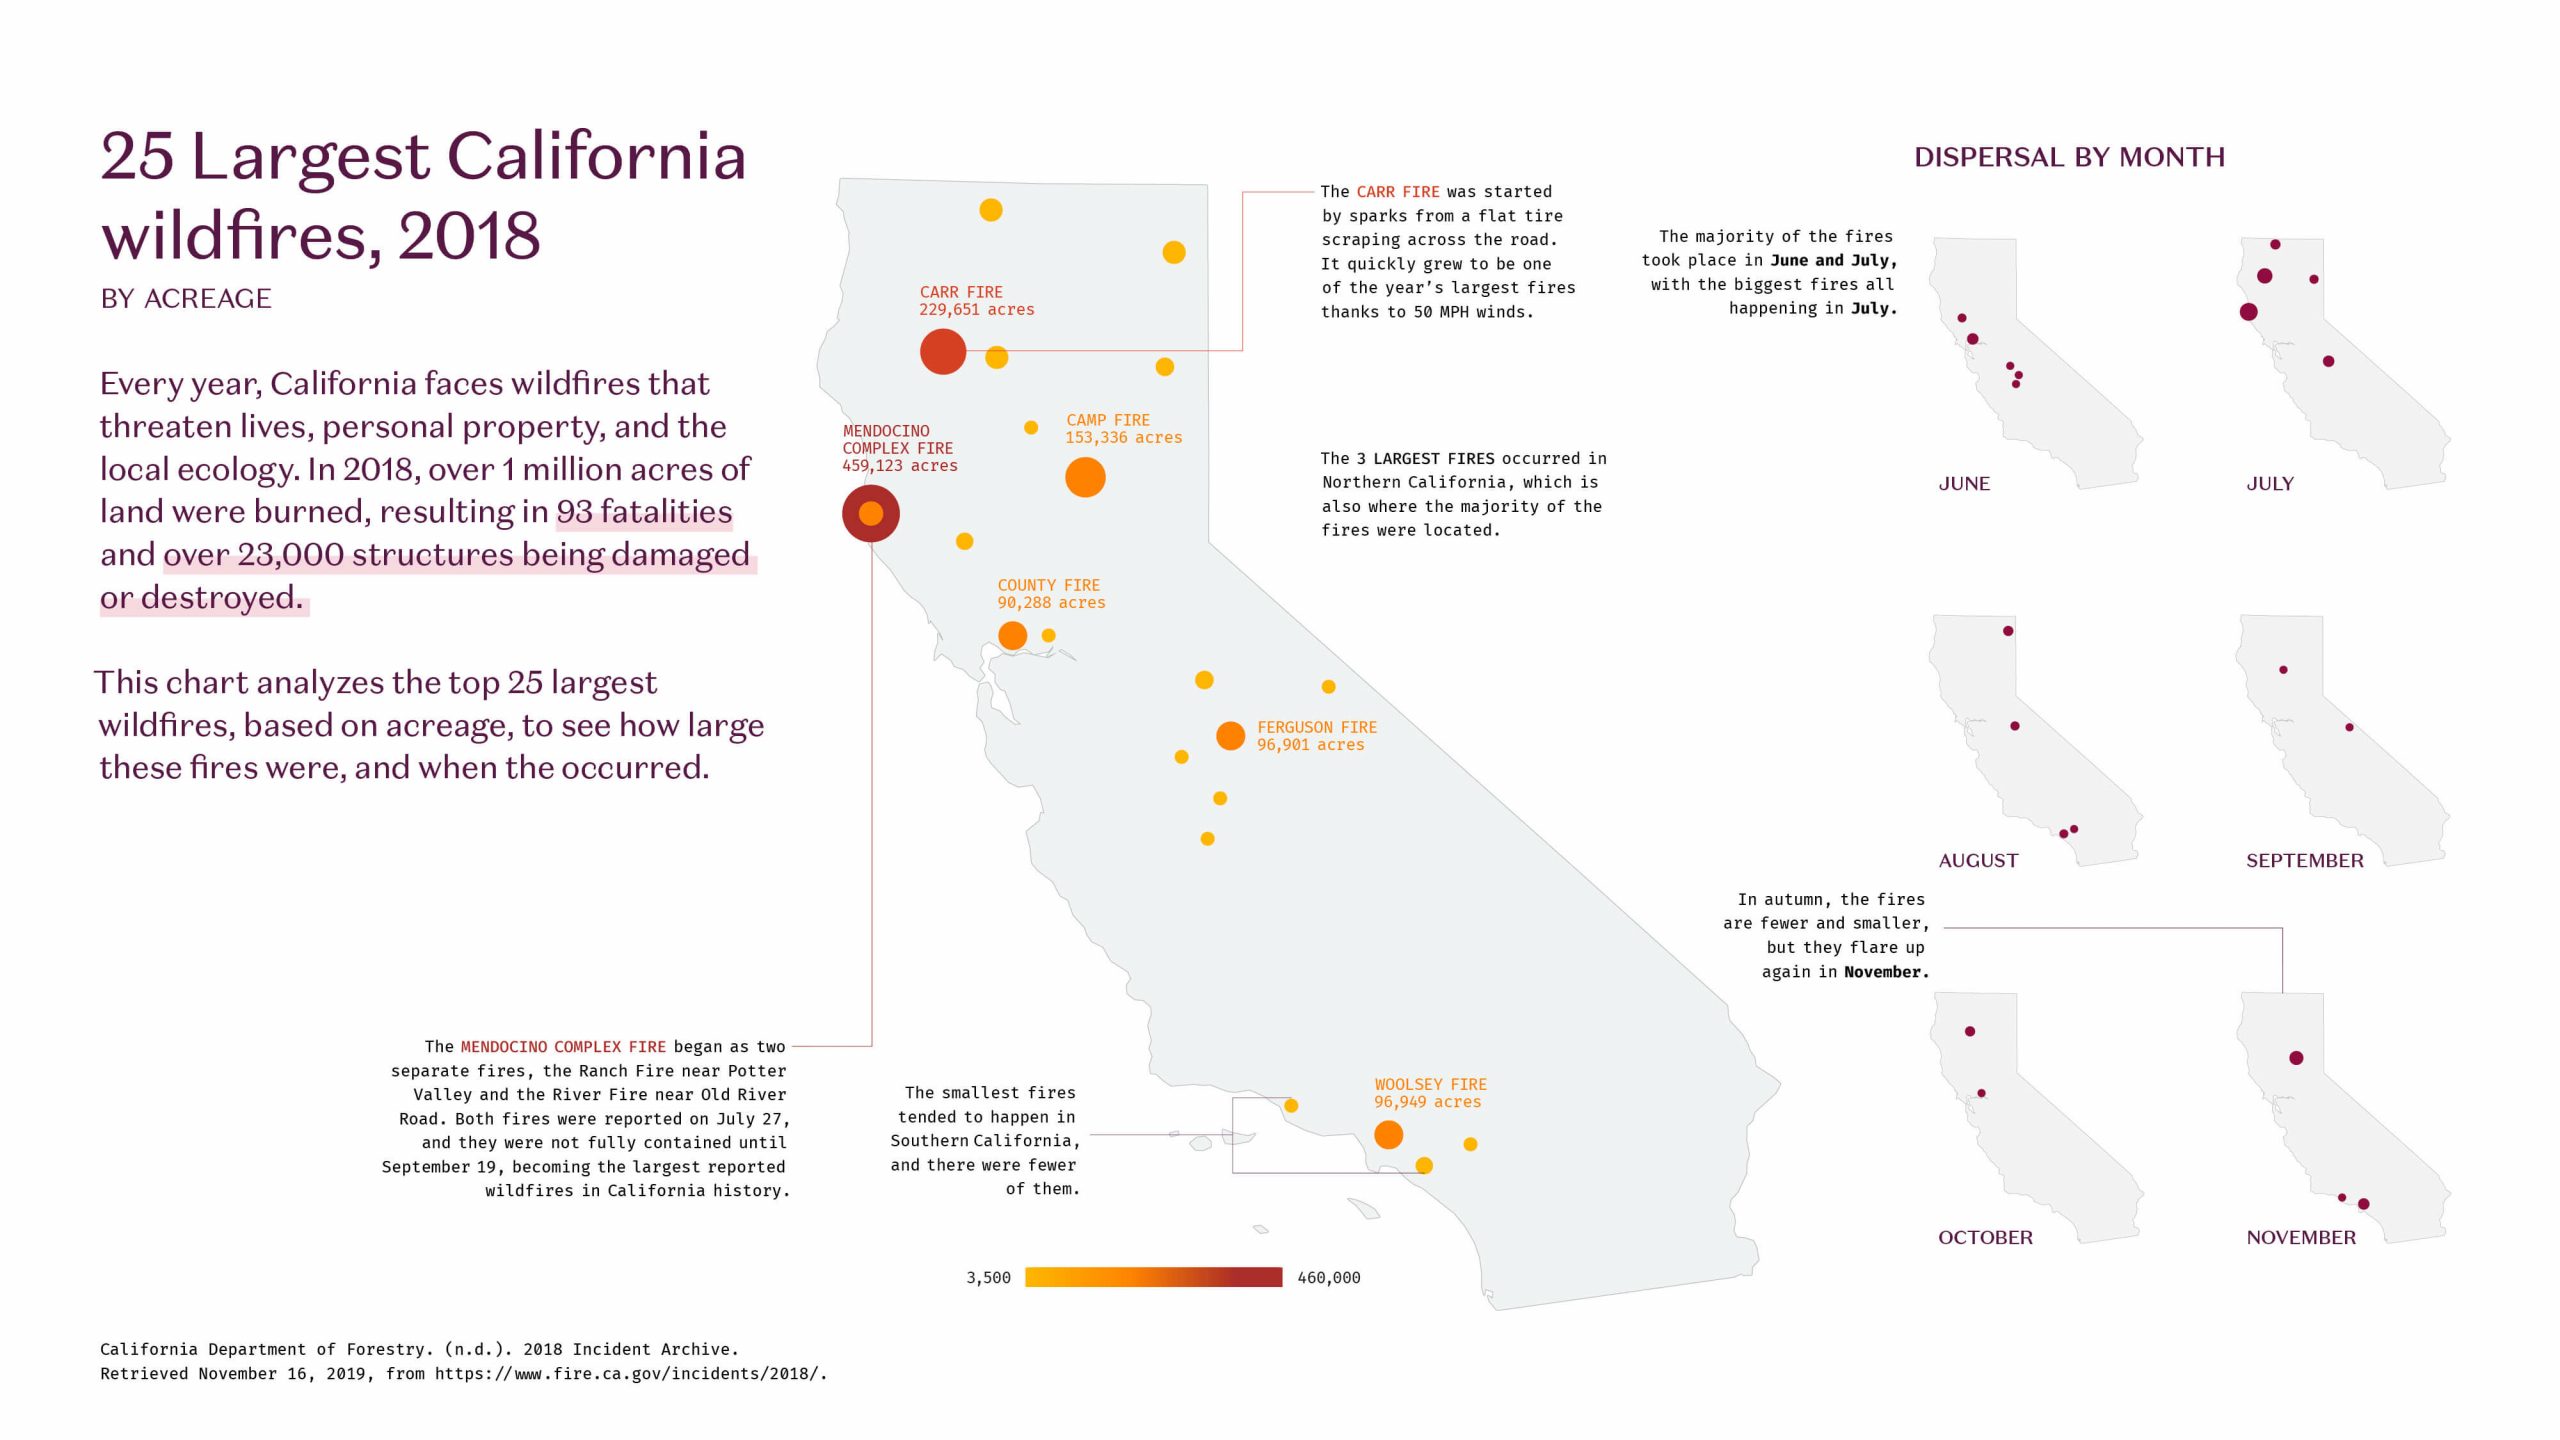
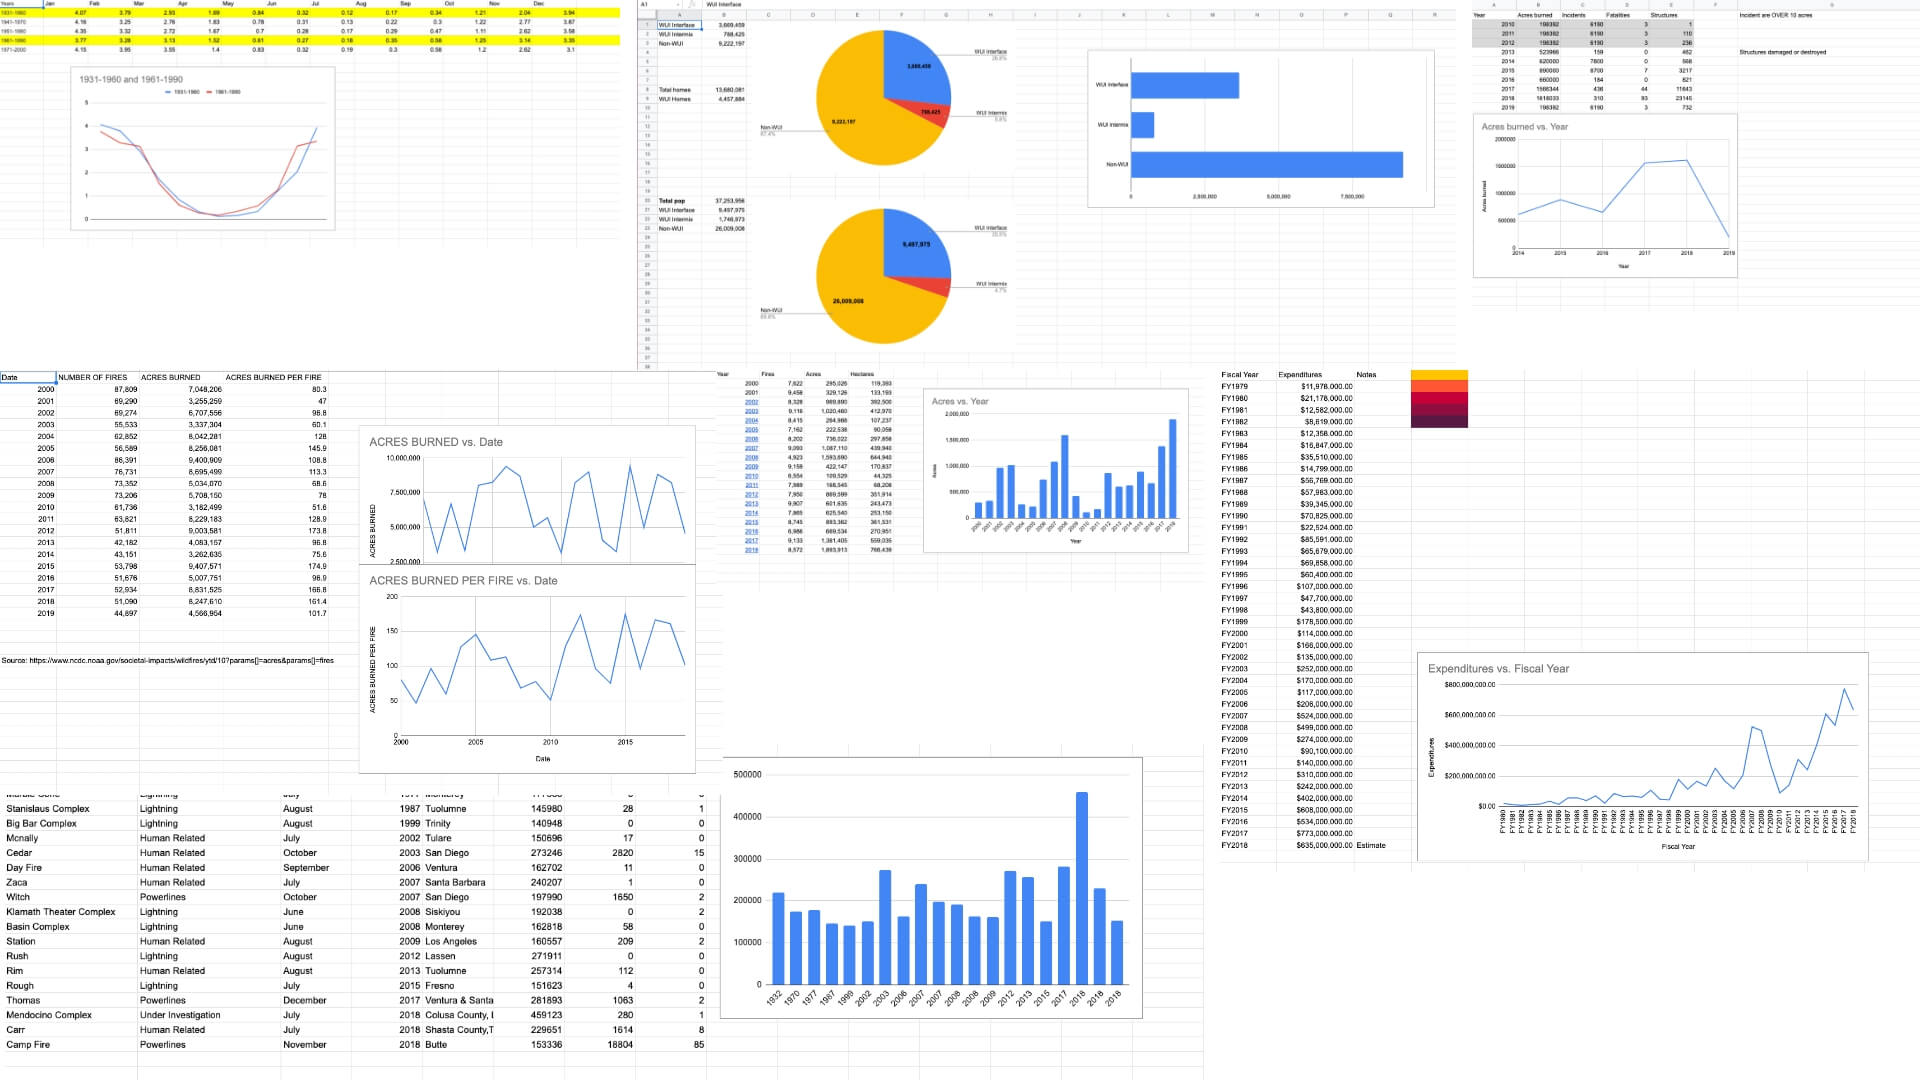
I had to read through many different articles and sift through a lot of data before patterns began to emerge, but by keeping the data organized and generating graphs the story became clearer, and I was able to form a cohesive thesis for my infographics.

Graphic design
The final step was to create a visual presentation. I already had my charts and graphs, but I know it’s important to tell stories in ways that are compelling and interesting, so people want to learn more. I experimented with a few different visual styles before settling on a gold-orange-purple gradient with “map” elements to refer back to the issues of land and wilderness.
Conclusion
I completed this project as part of my master’s program, and I’m still proud of the work I did here. I learned a great deal about the best ways to synthesize large amounts of data and create information graphics. I’m able to use the skills I learned in my UX design role regularly to present user-test findings or social campaign performance, and I’m able to be more discerning about the infographics I encounter in my own life.
Special thanks
Dr. Claire Lauer, whose technical writing and information design class was instructive and inspiring.
